
-
$10.61$0.00 (0.00%)
NAVAs of 4/1/26 -
$1.08 BTotal Net AssetsAs of 4/1/26
-
1.80%YTD ReturnAs of 4/1/26
- 10.2%Private Credit Portfolio YieldAs of 2/28/26
Fund Highlights
Enhanced Income
Target attractive yield and lower correlation with a focus on principal preservation.
Diversified Exposure
Invests across the private credit asset class, beyond direct lending and corporate credit.
Institutional Access
Sources opportunities from hundreds of leading private credit originators and private equity sponsors.
Investor-friendly Structure
- Attractive fees – 1.25%
- Monthly distributions and quarterly repurchases
- 1099-DIV reporting
Performance
As of 2/28/26
How to Invest
Financial advisors and institutional investors can purchase fund shares on a daily basis, using the ticker symbol CAPIX.
Contact UsMonthly Returns (%)
As of 2/28/26
| Jan | Feb | Mar | Apr | May | Jun | Jul | Aug | Sep | Oct | Nov | Dec | Year | |
|---|---|---|---|---|---|---|---|---|---|---|---|---|---|
| 2023 | 0.40* | 0.70 | 0.89 | 0.59 | 0.77 | 1.67 | 1.12 | 6.31 | |||||
| 2024 | 1.07 | 0.77 | 1.44 | 1.01 | 0.95 | 0.66 | 1.14 | 1.12 | 0.61 | 0.99 | 1.09 | 1.30 | 12.85 |
| 2025 | 0.66 | 0.60 | 0.99 | 0.61 | 1.27 | 0.80 | 0.70 | 0.80 | 0.99 | 0.24 | 0.99 | 0.61 | 9.66 |
| 2026 | 0.66 | 0.47 | 1.13** |
**Performance value represents year to date
Annualized Returns
As of 2/28/26
| Year-To-Date | 1-Year Return | Since Inception Annualized Return | |
|---|---|---|---|
| CAPIX | 1.13% | 9.51% | 11.04% |
Portfolio
Private Credit Portfolio Statistics1
| # Underlying Loans: | 174 |
|---|---|
| # of Industries: | 43 |
| # Sourcing Partners: | 91 |
| First Lien: | 90% |
| Floating Rate: | 89% |
| Avg Loan to Value: | 46% |
| Avg EBITDA: | $158.8M |
| Duration (Years): | 0.24 |
| Avg. Maturity (Years): | 4.43 |
As of 2/28/26
Private Credit Portfolio Strategy2
As of 2/28/26
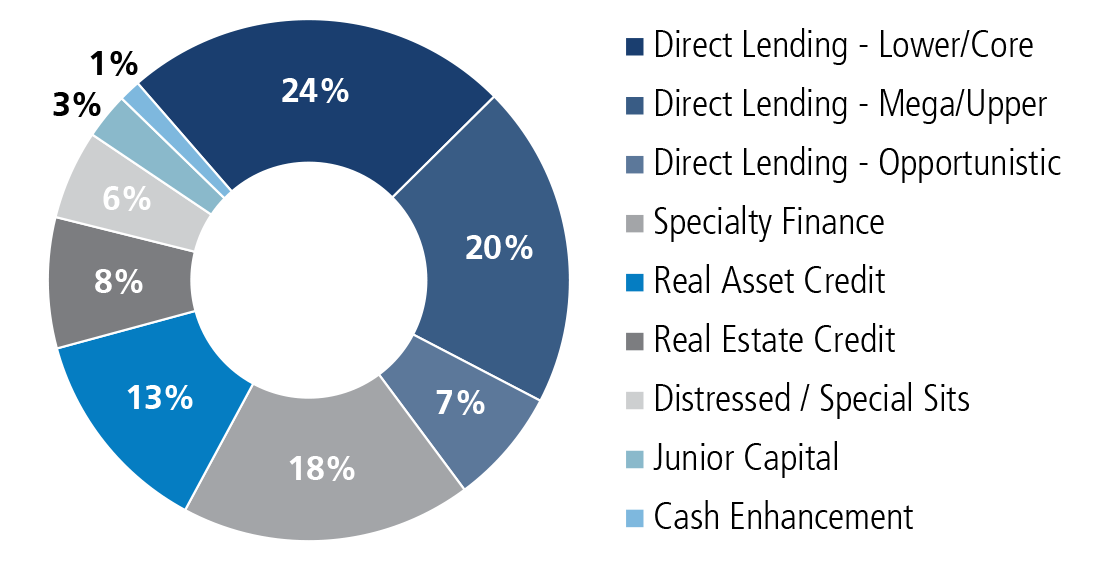
Private Credit Portfolio: Strategy/Substrategy3
| Direct Lending – Lower/Core | 24% |
|---|---|
| US Direct Lending - Core | 14% |
| US Direct Lending - Lower | 6% |
| Euro Direct Lending - Core | 3% |
| Euro Direct Lending - Lower | 1% |
| Direct Lending – Mega/Upper | 20% |
| US Direct Lending - Upper | 14% |
| US Direct Lending - Mega | 5% |
| European Direct Lending - Upper | 1% |
| Direct Lending – Opportunistic | 7% |
| US Direct Lending - Opp | 7% |
| Specialty Finance | 18% |
|---|---|
| PE Portfolio Finance | 4% |
| Insurance Linked Credit | 2% |
| Stretch ABL | 2% |
| Consumer & SME Lending | 2% |
| Music/Film/Media Royalties | 2% |
| Technology Lending | 2% |
| Regulatory Capital | 2% |
| Diversified Specialty Finance | 1% |
| Litigation Finance | 1% |
| Real Asset Credit | 13% |
| Infrastructure Lending | 10% |
| Energy Credit | 2% |
| Transportation Credit | 1% |
| Real Estate Credit | 8% |
|---|---|
| US CRE Transitional Lending | 4% |
| US Large Loan CRE Bridge | 1% |
| US CRE Bridge Lending | 1% |
| Mortgage Lending | 1% |
| Distressed / Special Sits | 6% |
| Capital Solutions | 4% |
| PC Secondaries | 1% |
| Junior Capital | 3% |
| Structured Equity | 3% |
| Cash Enhancement | 1% |
| US Direct Lending - Mega | 1% |
As of 2/28/26
Industry Weightings
| Financial Services | 11.2% |
|---|---|
| Software | 9.5% |
| Real Estate Management & Development | 7.9% |
| Professional Services | 7.8% |
| Commercial Services & Supplies | 6.2% |
| IT Services | 4.9% |
| Insurance | 4.2% |
| Health Care Providers & Services | 4.2% |
| Oil, Gas & Consumable Fuels | 4.0% |
| Media | 3.2% |
| Aerospace & Defense | 2.7% |
|---|---|
| Construction & Engineering | 2.6% |
| Diversified Consumer Services | 2.4% |
| Specialty Retail | 2.3% |
| Health Care Equipment & Supplies | 2.2% |
| Machinery | 1.8% |
| Consumer Staples Distribution & Retail | 1.6% |
| Capital Markets | 1.6% |
| Consumer Finance | 1.6% |
| Other4 | 18.2% |
As of 2/28/26
CAPIX Provides Diversification Across the Private Credit’s Sectors and Strategies
Direct Lending
- US direct lending
- European direct lending
- Emerging markets direct lending
Distressed Debt and Special Situations
- “Credit opportunities”
- Corporate distressed
- Opportunistic structured credit
- Real estate distressed
- NPLs
- Capital solutions/rescue finance
- “Special situations” loans
Speciality Finance
- Consumer and SME lending
- Rediscount lending
- Factoring and receivables
- Regulatory capital relief
- Royalties*
- Venture lending
- Technology lending
- Financial services credit
- Insurance-linked credit
- Litigation finance
- Stretch ABL
- NAV loans
- Structured secondaries
Real Estate Credit
- US corporate real estate (CRE lending: core transitional, bridge lending)
- European CRE lending
- Emerging markets CRE lending
- CRE structured credit
- Residential mortgages
Real Assets Credit
- Infrastructure lending
- Energy credit
- Trade finance
- Metals and mining finance
- Agricultural credit
- Transportation
Mezzanine
- US mezzanine
- European mezzanine
- Structured equity
- PIK Holdco
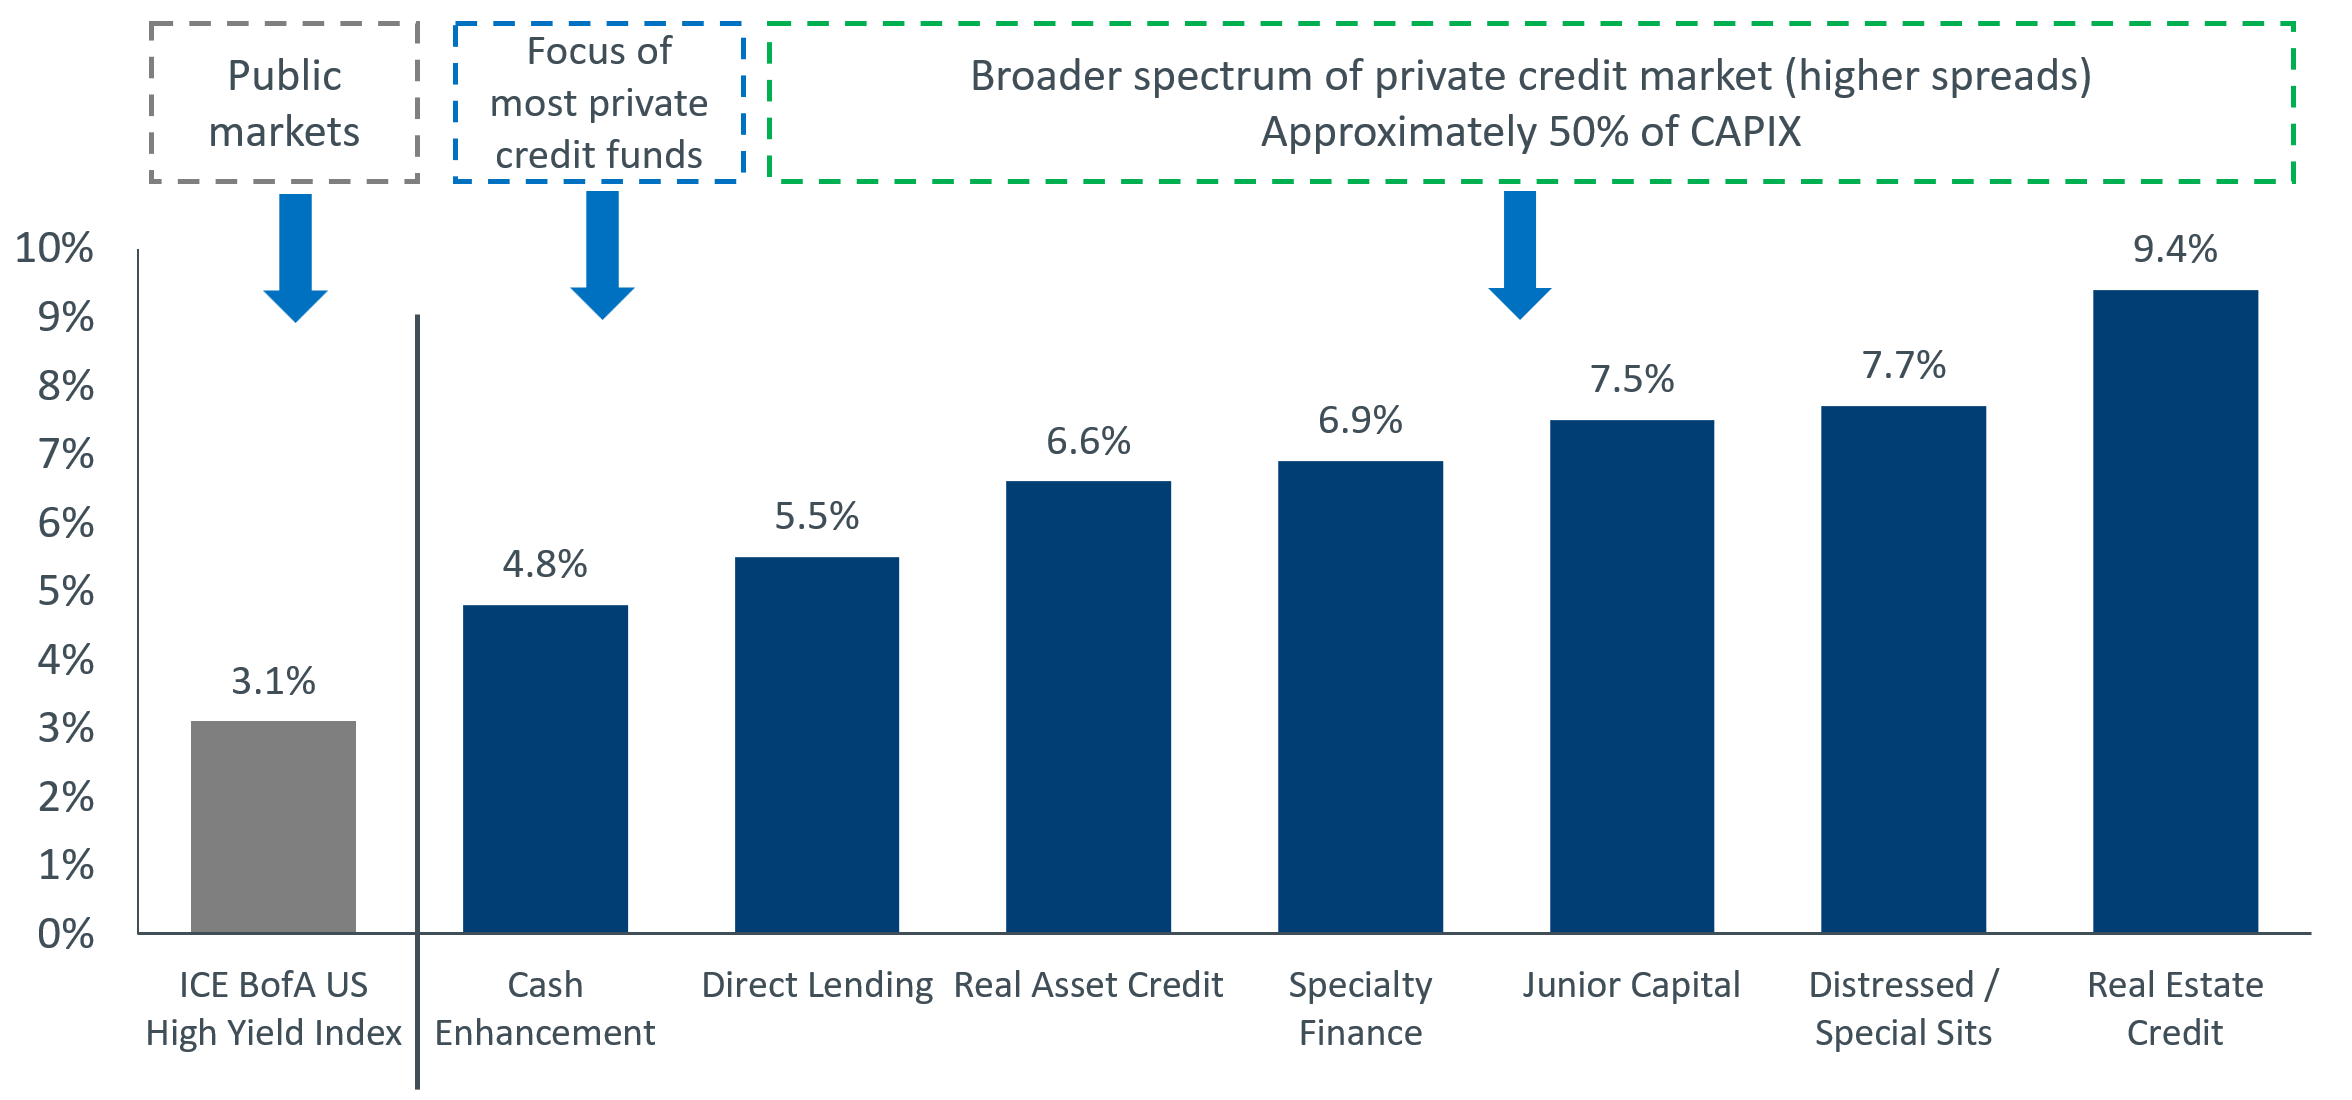
Median New Issue Spread By Sector
As of 2/28/26
Leadership
John P. Calamos, Sr.
Founder, Chairman and Global Chief Investment Officer, Calamos Investments
Matt Freund, CFA
Co-CIO, Head of Fixed Income Strategies, and Senior Co-Portfolio Manager, Calamos Investments
Eli Pars, CFA
Co-CIO, Co-Head of Alternative Strategies, Co-Head of Convertible Strategies, & Senior Co-Portfolio Manager, Calamos Investments
Michael Kassab, CFA
Senior Vice President, Chief Market Strategist, Associate Portfolio Manager, Calamos Investments
Distributions
Capital Gains
2025 capital gains distribution for Calamos Aksia interval funds were declared December 15, 2025. To view the report, click here.
Fund Information
| Ticker: | CAPIX (Share Class I) |
|---|---|
| Objective: | The fund seeks attractive risk-adjusted returns and high current income |
| Structure: | Interval Fund (40-Act registered) with daily purchase and quarterly repurchase |
| Accreditation Requirement: | None |
| Purchase: | Daily |
| Benchmark: | Morningstar LSTA US Leveraged Loan Index |
| Leverage: | Up to 25% |
|---|---|
| Liquidity Terms: | Quarterly; no less than 5% of outstanding shares |
| Distributions: | Monthly |
| Tax Reporting: | 1099-DIV |
| Management Fee5: | 1.25% |
| Performance Fee: | None |
Literature
About the Fund
Research & Education
Prospectus and Reports


How to Invest
Financial advisors and institutional investors can purchase fund shares on a daily basis, using the ticker symbol CAPIX.
Contact Us